Below we outline tools that will help the user plan their observations, and so aid with proposals.
Target list creation
The first stop for TESS GI proposers when preparing their proposals should be the STScI/MAST TESS pages. Here, proposers can follow tutorials to learn how to access the Target Input Catalog (TIC) and Candidate Target List (CTL), crossmatch their targets with these catalogs, and create output files with relevant target information required for the GI call. The TESS GI program office requires that if a target is in the TIC, GI proposers must provide only the following columns from the TIC in comma separated value (csv) format:
- TIC ID (if available)
- Right Ascension (decimal degrees)
- Declination (decimal degrees)
- Proper motion in Right Ascension (mas yr-1)
- Proper motion in Declination (mas yr-1)
- TESS mag
Since adherence to this format is critical for target list uploads to the Remote Proposal System (RPS) website, the MAST has provided a custom tutorial to show GI proposers how to select and output these columns for their target lists. Please follow this tutorial to provide a compliant target list.
In addition to the above six columns, the following additional columns can be provided as necessary (the columns order must not change):
- Common name of target
- Extended flag
- Special handling flag
- 20-second cadence flag
- Swift time request (ksec)
- Remarks
TESS-point Web Tool
The TESS-point Web Tool allows users to check whether a target potentially falls within the TESS field of view (FOV). In addition, the tool can be used to calculate the brightness of a target in the TESS bandpass.
The user provides the name (or TIC ID, or RA/DEC) of an object, and the tool will output which sector and camera the object is expected to be observed with (or null results if it will not fall in the TESS FOV).
For larger sets of targets, the TESS-point Web Tool will take an input file (csv) with RA and DEC (in decimal) and return the potential visibility (sector/camera) per object.
This tool can also be used to estimate the magnitude and photometric error for a point source given known magnitudes (based on the functionality of the ticgen tool, described below).
ticgen
ticgen is a Python package that allows users to calculate a TESS magnitude from various other bandpasses, and calculate a 1-sigma noise level. This feature is also enabled in the TESS-point Web Tool. This package adds the ticgen and ticgen-csv tools to the command line.
The code and documentation is hosted on Github and only briefly summarized here.
Installation:
Users will need to have a working version of Python 2 or 3 installed. If this requirement is met, ticgen can be installed using pip:
pip install ticgen
If you have a previous version installed, please make sure you upgrade to the latest version using:
pip install ticgen --upgrade
It is important to upgrade frequently to ensure that you are using the most up to date TESS field parameters.
Usage:
Installing ticgen will automatically add a command line tool to your path called ticgen, which takes a magnitudes as input.
For example,
$ ticgen -V 7.5 -J 12.0 -Ks 11.5

TESS mag = 10.09, calculated using V/J/Ks.
1-sigma scatter in 60 min = 212 ppm.
You can provide any combination of these magnitudes
- -T TMAG, --Tmag TMAG TESS magnitude of the source
- -J JMAG, --Jmag JMAG J magnitude of the source
- -K KSMAG, --Ksmag KSMAG Ks magnitude of the source
- -V VMAG, --Vmag VMAG V magnitude of the source
- -G GMAG, --Gmag GMAG Gaia magnitude of the source
- -H HMAG, --Hmag HMAG H magnitude of the source
- -B BMAG, --Bmag BMAG B magnitude of the source
- --Bphmag BPHMAG B photographic magnitude of the source
You can also specify the integration time in minutes. * -i INTEGRATION, --integration INTEGRATION This will be used to calculate the noise. This assumes noise scales with the inverse square-root of the integration time. (default: 60)
$ ticgen --Tmag 18.0 --integration 1440

TESS mag = 18.00, calculated using Tmag was provided.
1-sigma scatter in 1440 min = 51045 ppm.
You can also run this on a comma-separated variable file with magnitudes. The header of the file must contain one or more of Tmag, Vmag, Jmag, Bmag, Bphmag, Ksmag, Hmag, and Gmag. Not all the magnitudes need to be included in the file and the columns can be in any order.
A new csv file will be created with two columns: TESS mag and 1-sigma noise level in parts-per-million.
Here is an example of an acceptable file:
Tmag,Vmag,Jmag,Bmag,Bphmag,Ksmag,Hmag,Gmag
12.0,,,,,,,
,11.5,8.1,,,6.7,,
,,,,,,16.0,
,,12.0,12.0,,8.6,,
and this would output:
# Tmag, 1-sigma noise (ppm)
    12.000,    595.007
     9.850,    188.867
    16.700,  32331.695
    12.872,   1030.614
This code is build using the algorithms from the TESS Input Catalog publication from Stassun et al. (2017).
TESS-Point
This is a High Precision TESS pointing tool. It will convert target coordinates given in Right Ascension and Declination to TESS detector pixel coordinates for the prime mission, first extension, and second extension. It can also query MAST to obtain detector pixel coordinates for a star by TIC ID only. It provides the target ecliptic coordinates, sector number, camera number, detector number, and pixel column and row. If there is no output, then the target is not visible to TESS.
Filtergraph
The TESS Target Selection Working Group (TSWG) has provided a tool for GI proposers to view and manipulate the current CTL in the Filtergraph data visualization system (Burger et al. 2013). Filtergraph is an online tool to upload data files, visualize the data in various formats (i.e. scatter plots, histograms, heat maps, etc.), manipulate these visualizations by filtering the data, and save figures and tables in standard image and data output formats.
The following figure provides an example of a CTL visualization that can be made using Filtergraph. The figure displays the ~400,000 highest priority stars in CTL-8 in Dec vs. RA and color-coded by T-mag. Features inherent to the CTL are immediately noticeable, such as the low density of targets in the Galactic plane (due to high background contamination and reddening), the ecliptic zone (which is not observed in the prime mission), and the higher density of targets near the ecliptic poles where TESS will have the longest continuous observation baseline and be more sensitive to transiting planets.
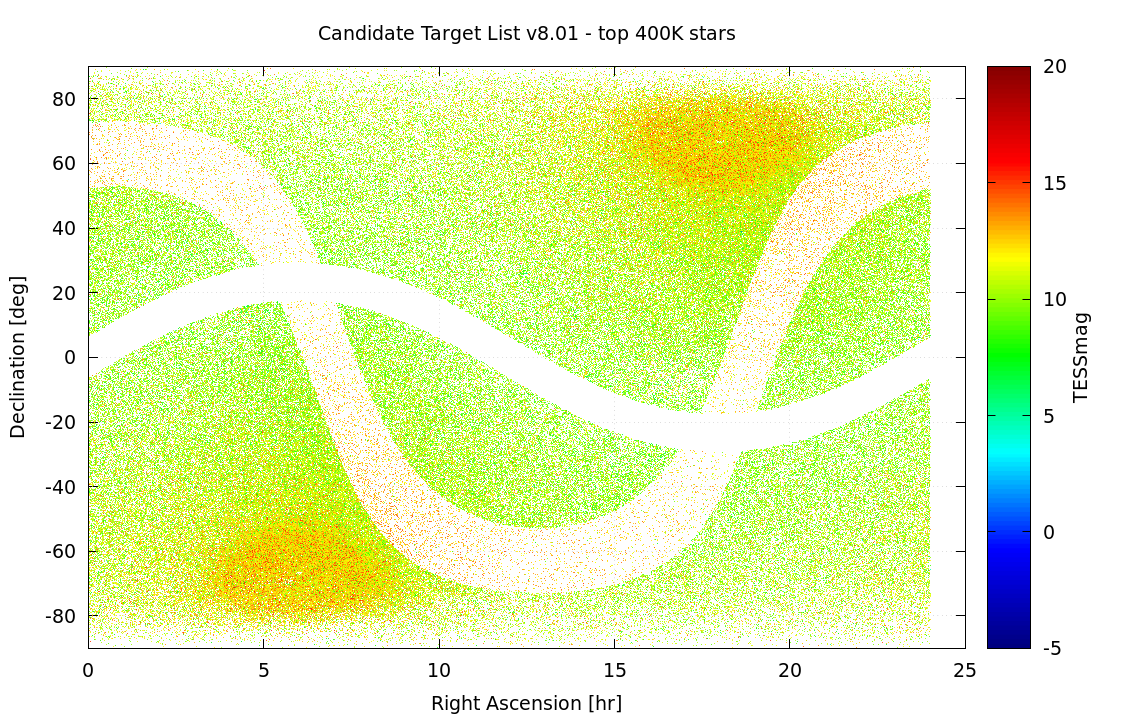 CTL-8 visualization generated using TIC/CTL Filtergraph portal. The
figure shows the distribution of stars in the CTL-8 in equatorial
coordinates. The color bar represents the targets' TESS
magnitudes. There are fewer stars in the Galactic plane due to
background contamination, and the ecliptic is not observed during the
prime mission. The two regions of higher target density are the
ecliptic poles, where TESS will observe continuously for nearly a
year. Image Credit: Filtergraph
CTL-8 visualization generated using TIC/CTL Filtergraph portal. The
figure shows the distribution of stars in the CTL-8 in equatorial
coordinates. The color bar represents the targets' TESS
magnitudes. There are fewer stars in the Galactic plane due to
background contamination, and the ecliptic is not observed during the
prime mission. The two regions of higher target density are the
ecliptic poles, where TESS will observe continuously for nearly a
year. Image Credit: Filtergraph
Additional pre-made figures are available on the CTL Filtergraph page. Users may also create their own free Filtergraph account and upload their own target lists for visualization following the instructions and tutorials on the main Filtergraph webpage.